I recently had the honor of spending time in Los Angeles speaking at a conference with the wise and very fun Katie Delahaye Paine, author and Queen of Measurement.
Click to enlarge
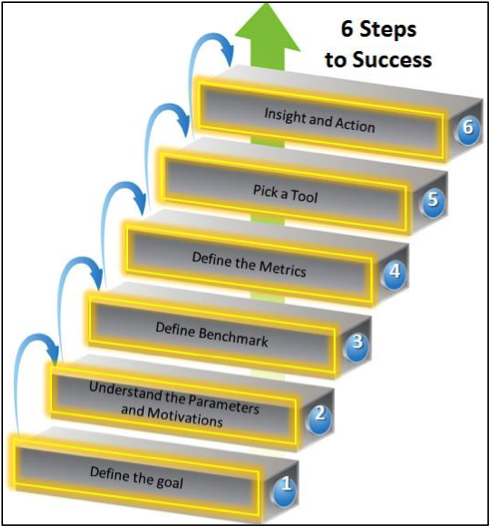
Katie discussed measurement effectiveness for nonprofit organizations and shared these Six Steps to Success.
(For more information check out Measuring the Networked Nonprofit, the best-selling book Katie co-authored with Beth Kanter.)
I got to follow with a session I love to deliver: Using Dashboards to Dazzle Your Staff and Board. (My slides can be found on SlideShare.)
When I asked Katie, “What is the ONE THING” that staff and board leadership should focus on in their measurement, here’s what she said:
My session then took the data and measurement discussion a step further where we discussed how to best SHOW your data in interesting easy to understand displays.
The message both Katie and I underscored is to identify and share data that is clear and inspires action from others.
The goal with any dashboard, chart or graph is simple:
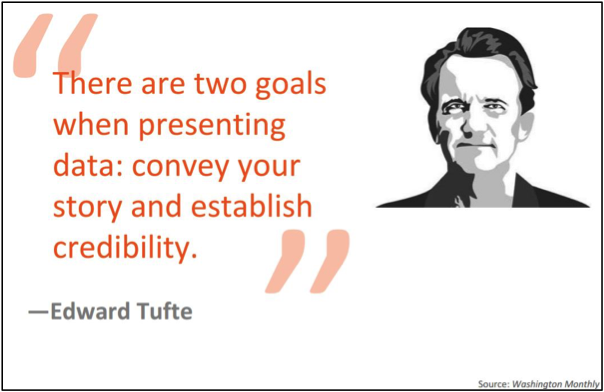
Talk with Lori to make sure your data is doing what it should: Schedule your FREE 30 minute strategy session